

When the inbox receives conversations from several channels, this report helps you understand where support is concentrated and who is handling the cases. Change the grouping and period to answer a specific question, such as whether website chats increased or which agent received more conversations during the month.
Choose the grouping that answers your question
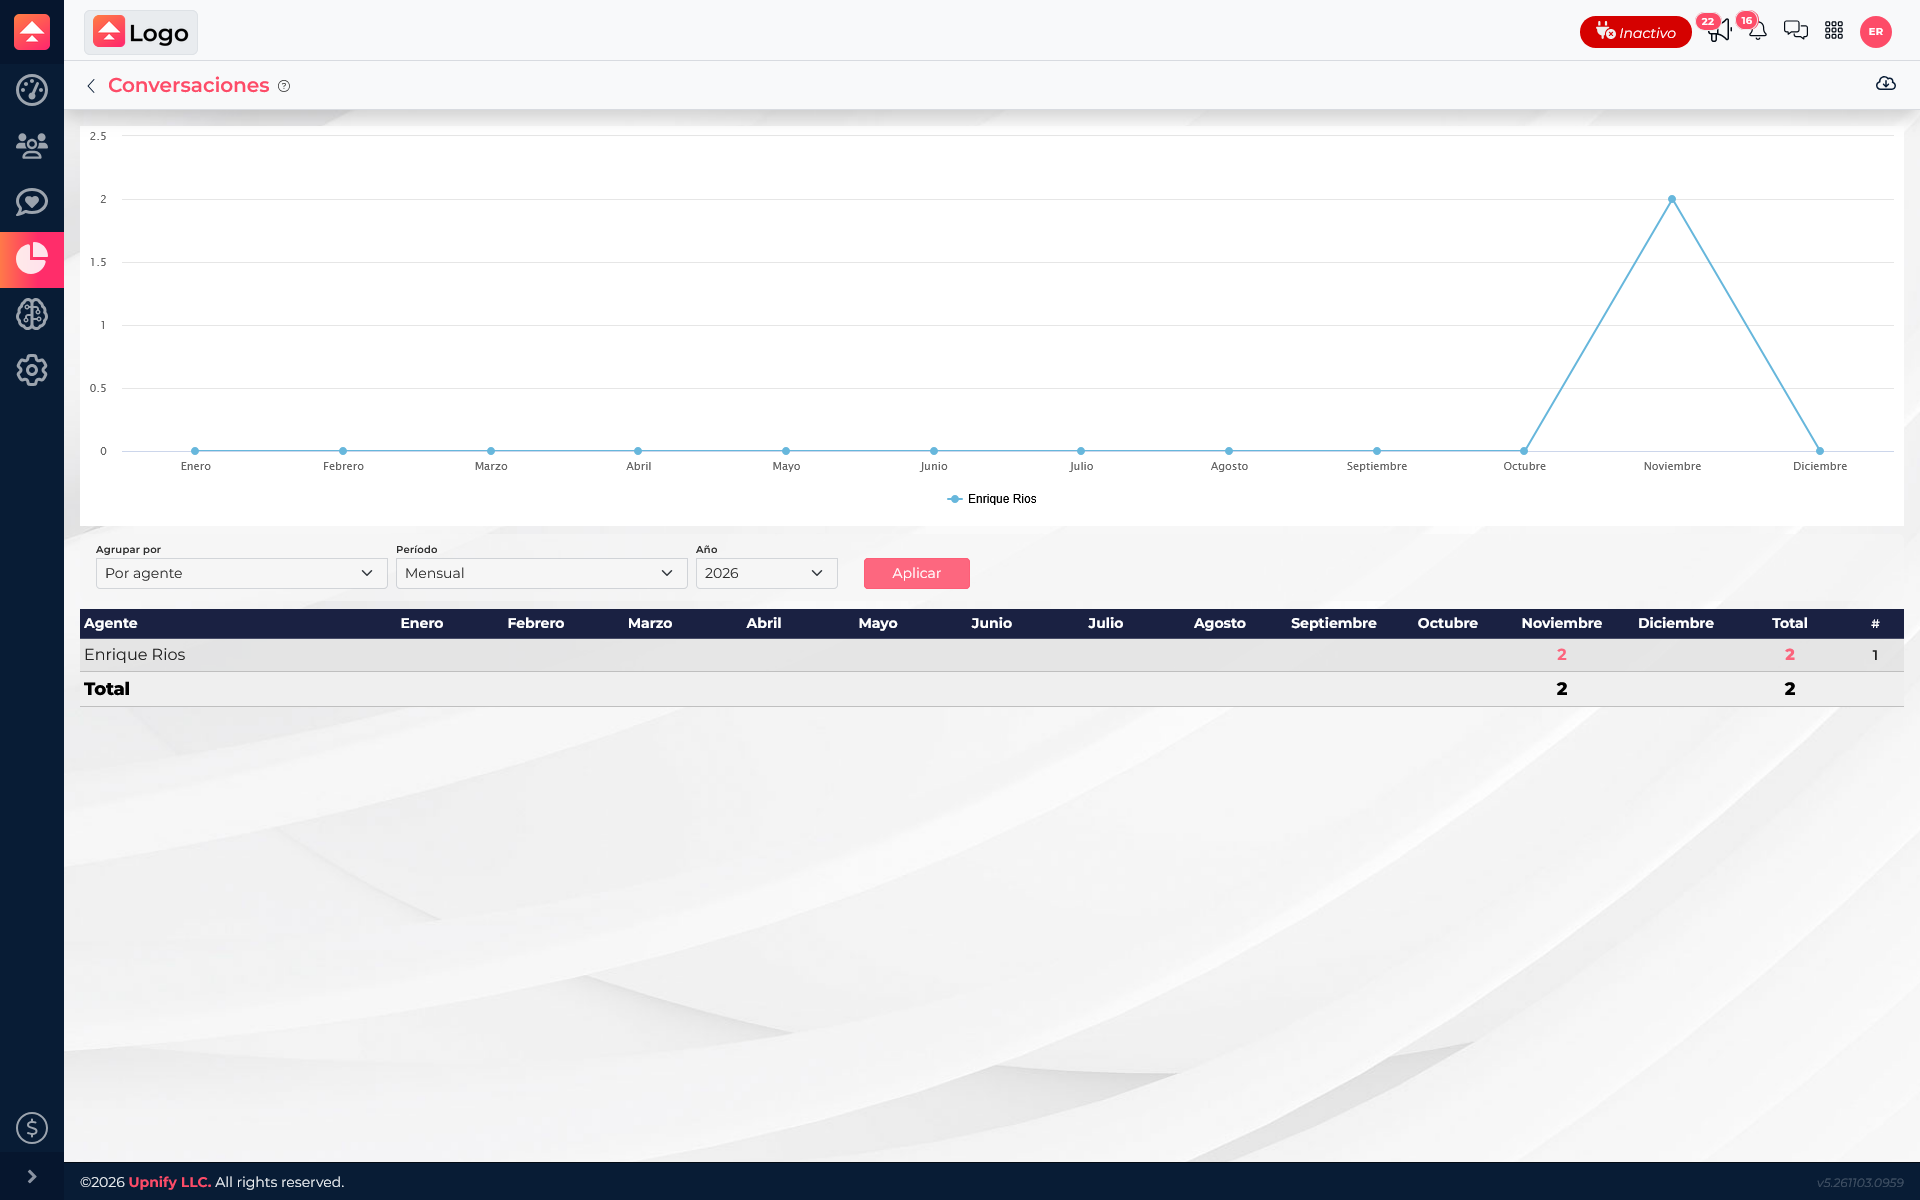
Open Reports and select Conversations. Under Group by, you can view the data in three ways:
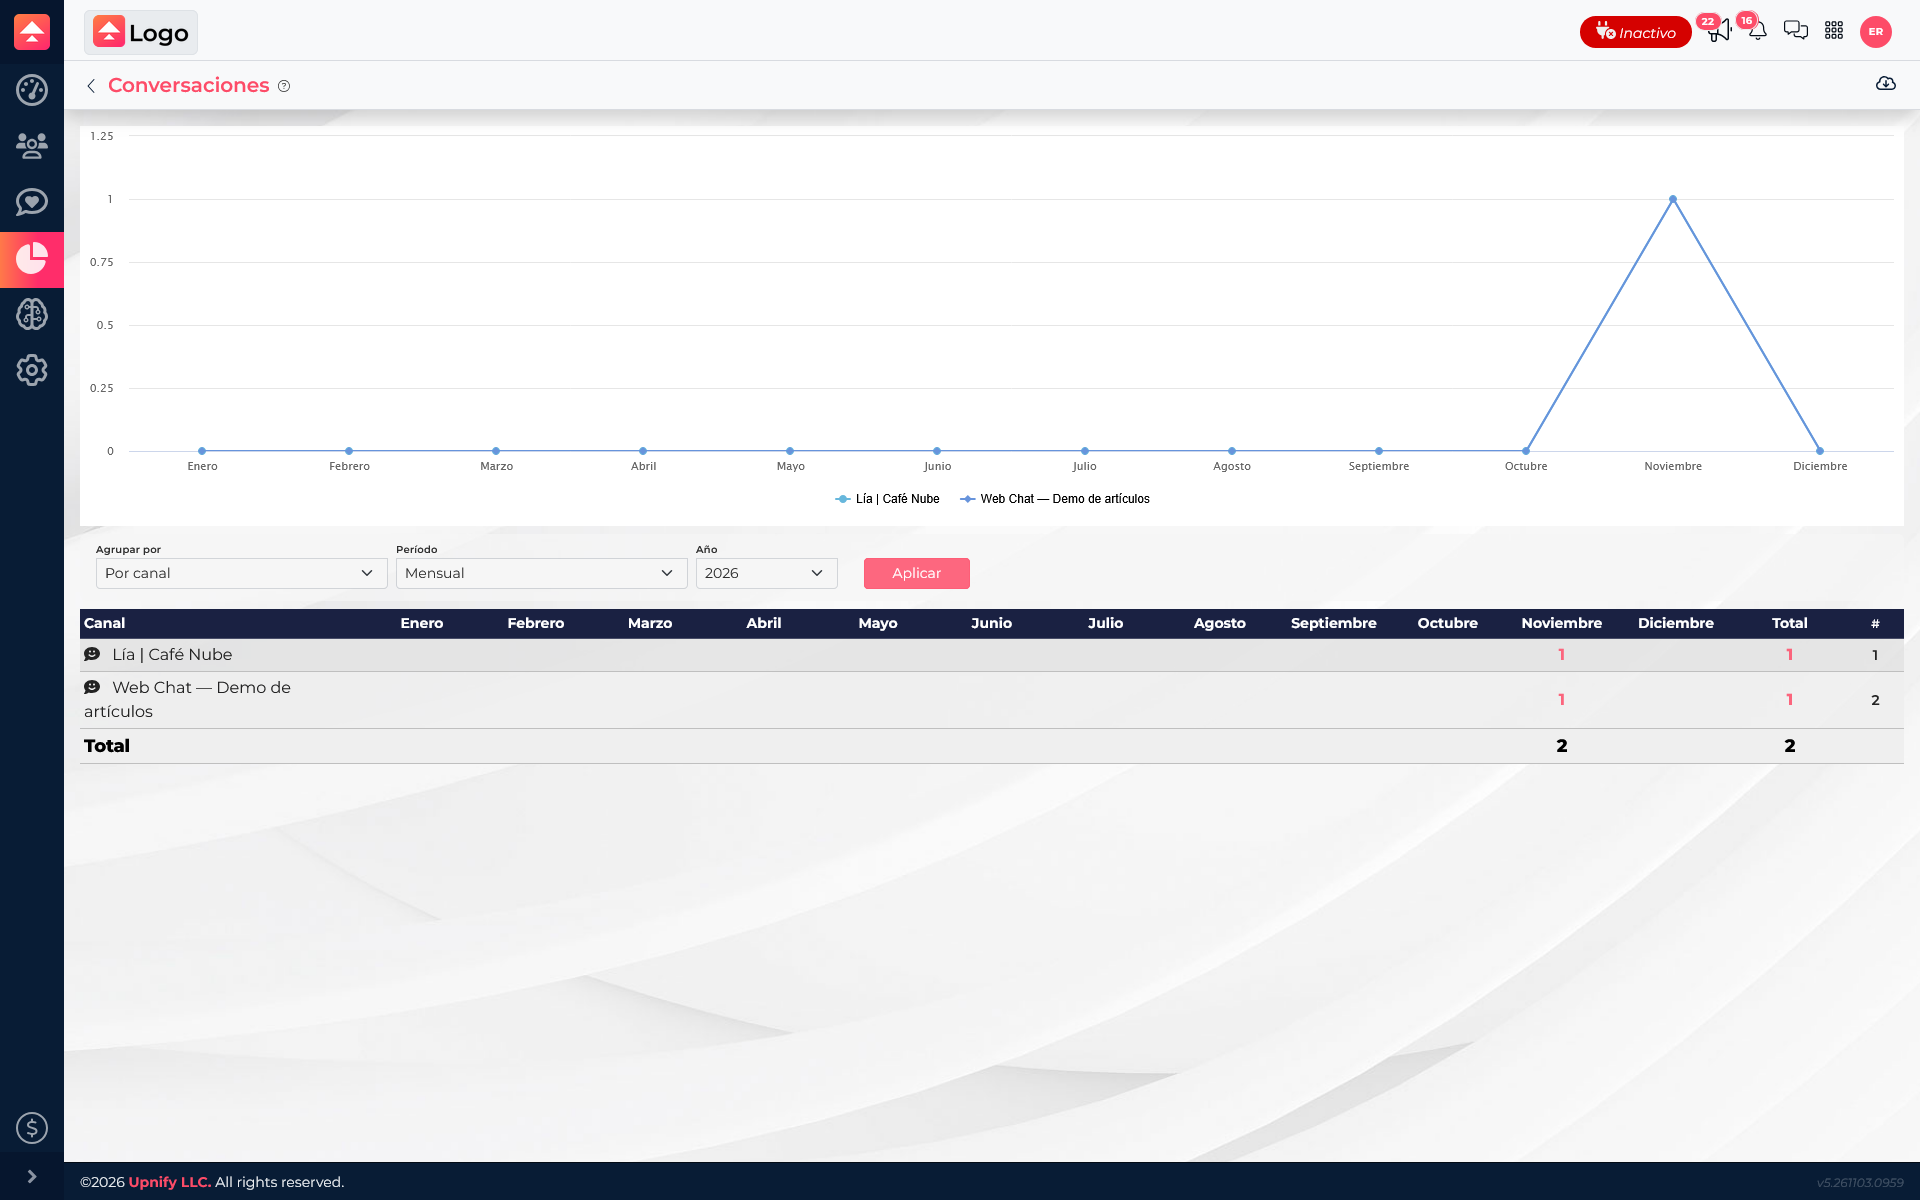
By agent shows the volume attributed to each agent. By channel compares configured channels such as WebChat, WhatsApp, or Messenger. Categories lets you review how conversations are distributed across available topics or categories.
Example: to find out whether website requests increased, choose By channel. To review how the team’s workload was distributed, choose By agent.
Choose a period and read the results
Select a monthly, weekly, or daily period, then choose the year or month you want to review. Click Apply to refresh the chart and table.
The chart helps you spot periods with more activity. In the table, each row represents an agent, channel, or category; columns represent periods, and Total summarizes the visible range.
Click a report value to open the conversations it includes. This takes you from a high-level comparison to the individual cases.
Use the report in a team review
Suppose the team receives questions through the website and another channel. Group by channel and compare weekly totals to see where volume increased. Then switch to By agent to review how that work was distributed.
The report counts conversations by their creation date. It does not count each message as a conversation or measure how long the team took to resolve it. Use the dedicated reports for response speed and connection time.
If you see no results, confirm the selected year and period, click Apply, and check whether filters or your permissions limit the visible records.