
Engage reports help you understand what happens after publishing a widget or page: how many activations it records, how many become prospects, and how activity changes over time. The right view prevents confusing a recent interval with a full-year history or an activation with a contact.
Review a period
In Results by period, choose a grouping, select the interval, and click Apply. Depending on the setup, you can compare by widget, page, or another available dimension. The table relates activations to recorded prospects, opportunities, customers, and amounts.

In the current period, the Solicitud para eventos widget recorded 3 activations, and all 3 entries reached CRM as prospects (100%). Two advanced to opportunities totaling MXN $76,500 (66.7%), and one became a customer with a MXN $48,000 sale (50%). Across all widgets, the report totals 16 activations, 3 prospects, 2 opportunities, and 1 customer. The other two widgets account for 13 activations with no visible conversions in this interval. This helps identify which stage may need follow-up; timing alone does not prove a widget caused a sale.
Review the historical trend
Open Historical results to see activity across months. Select the year, time interval, and grouping, then click Apply. The chart helps identify when activity rose or fell, and the table confirms each widget’s total.
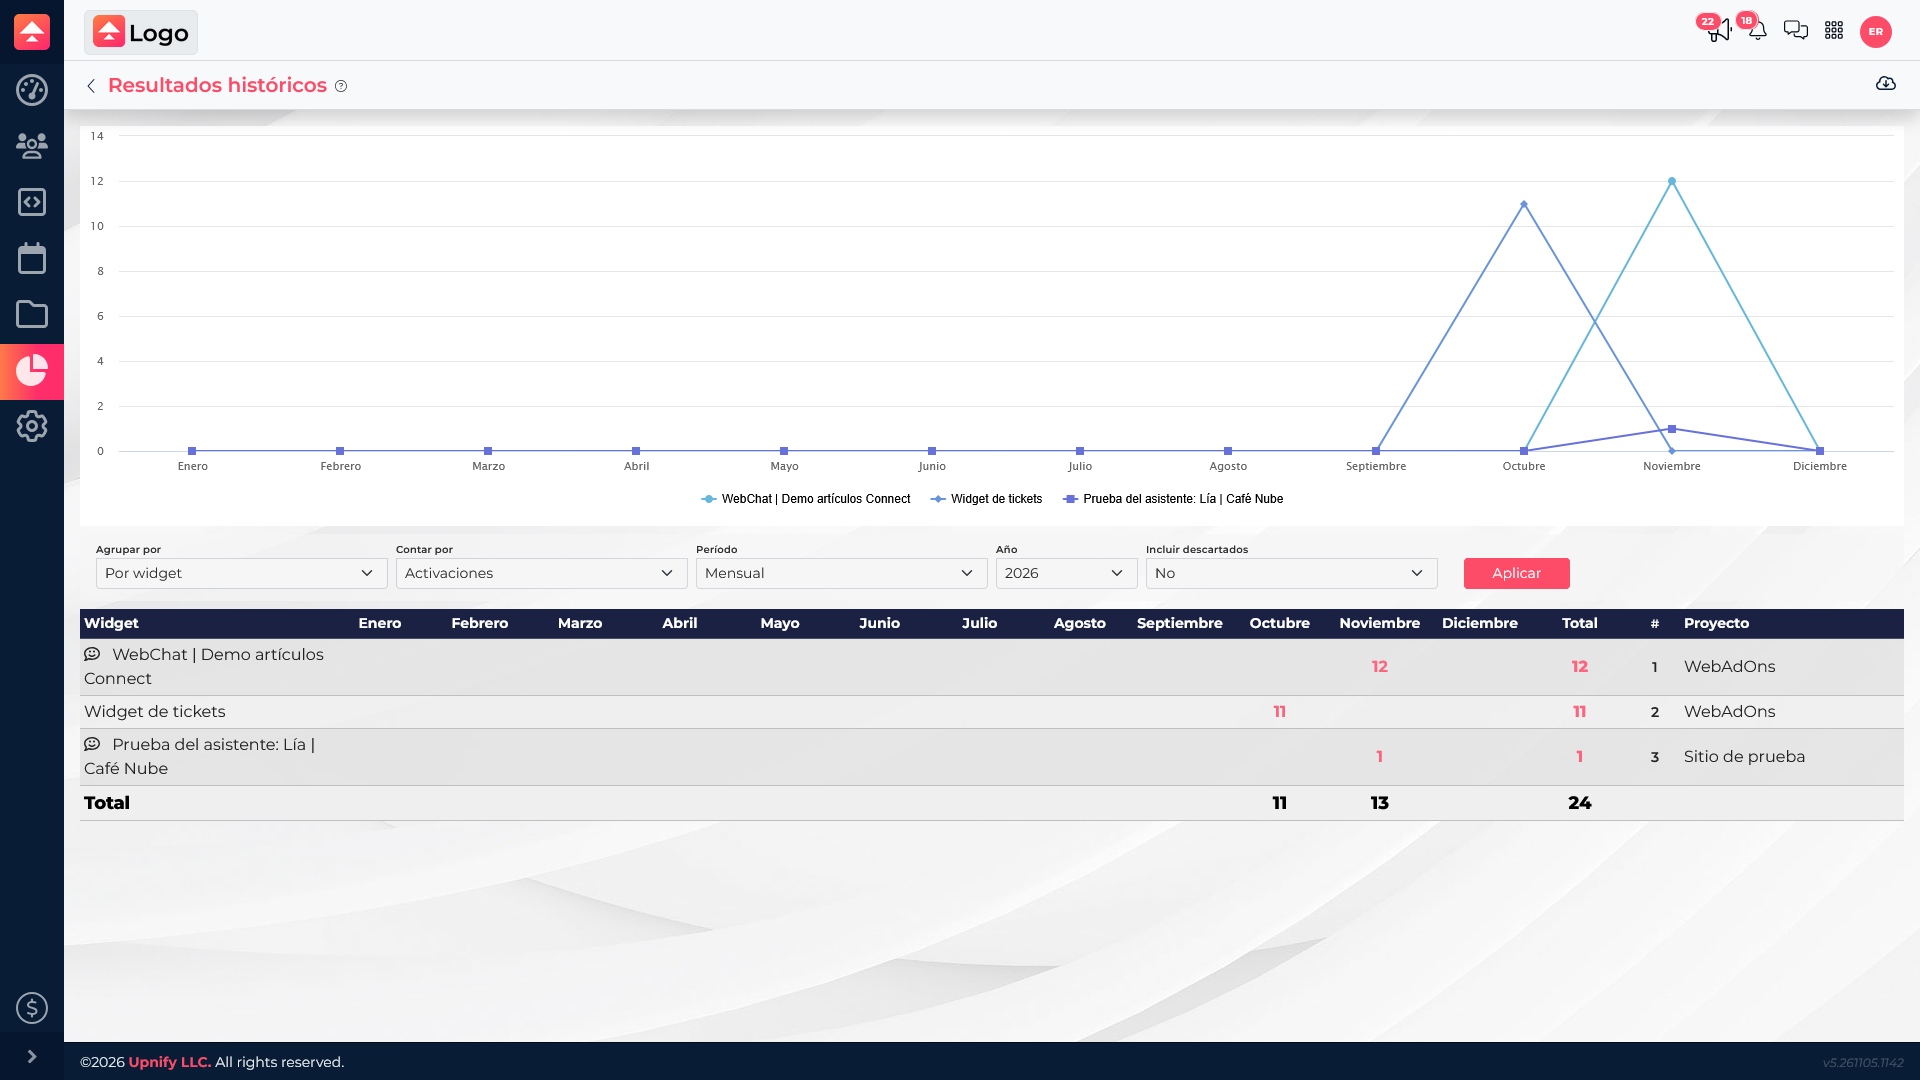
The example shows 11 activations for one widget in October and 13 across two widgets in November: 24 in the displayed year. This helps locate when activity occurred; it does not by itself prove that a particular change caused sales.
Interpret each stage correctly
| Data | What it represents | How to use it |
|---|---|---|
| Activations | Interactions counted by the report for a widget or page. | Compare activity across equivalent elements and periods. |
| Prospects and conversion | Entries that reached CRM and their relationship to activity. | Check whether people complete the form and the entry reaches CRM. |
| Opportunities, customers, and amounts | Associated commercial outcomes shown in the query. | Review follow-up; dates alone do not prove the widget caused a sale. |
For example, if a form gets activations but no prospects, check whether it asks for too much information, whether the button is clear, and whether submissions are connected to CRM. If activations rise in November, verify what changed on the website and compare other months.
When sharing results, state the view, period, and grouping. Two queries may show different totals if their filters differ.