

The Income and Expenses reports organize amounts recorded in ERP by month and relationship type. They answer different questions: how much came in, how much went out, which months were busiest, and whether an amount is associated with a customer, vendor, employee, or account.
Read the income report
- Open Reports ? General income.
- Under Related to, choose the group you need: customers, transfers, vendors, employees, or items not related to another entity.
- Select the Year and click Apply.
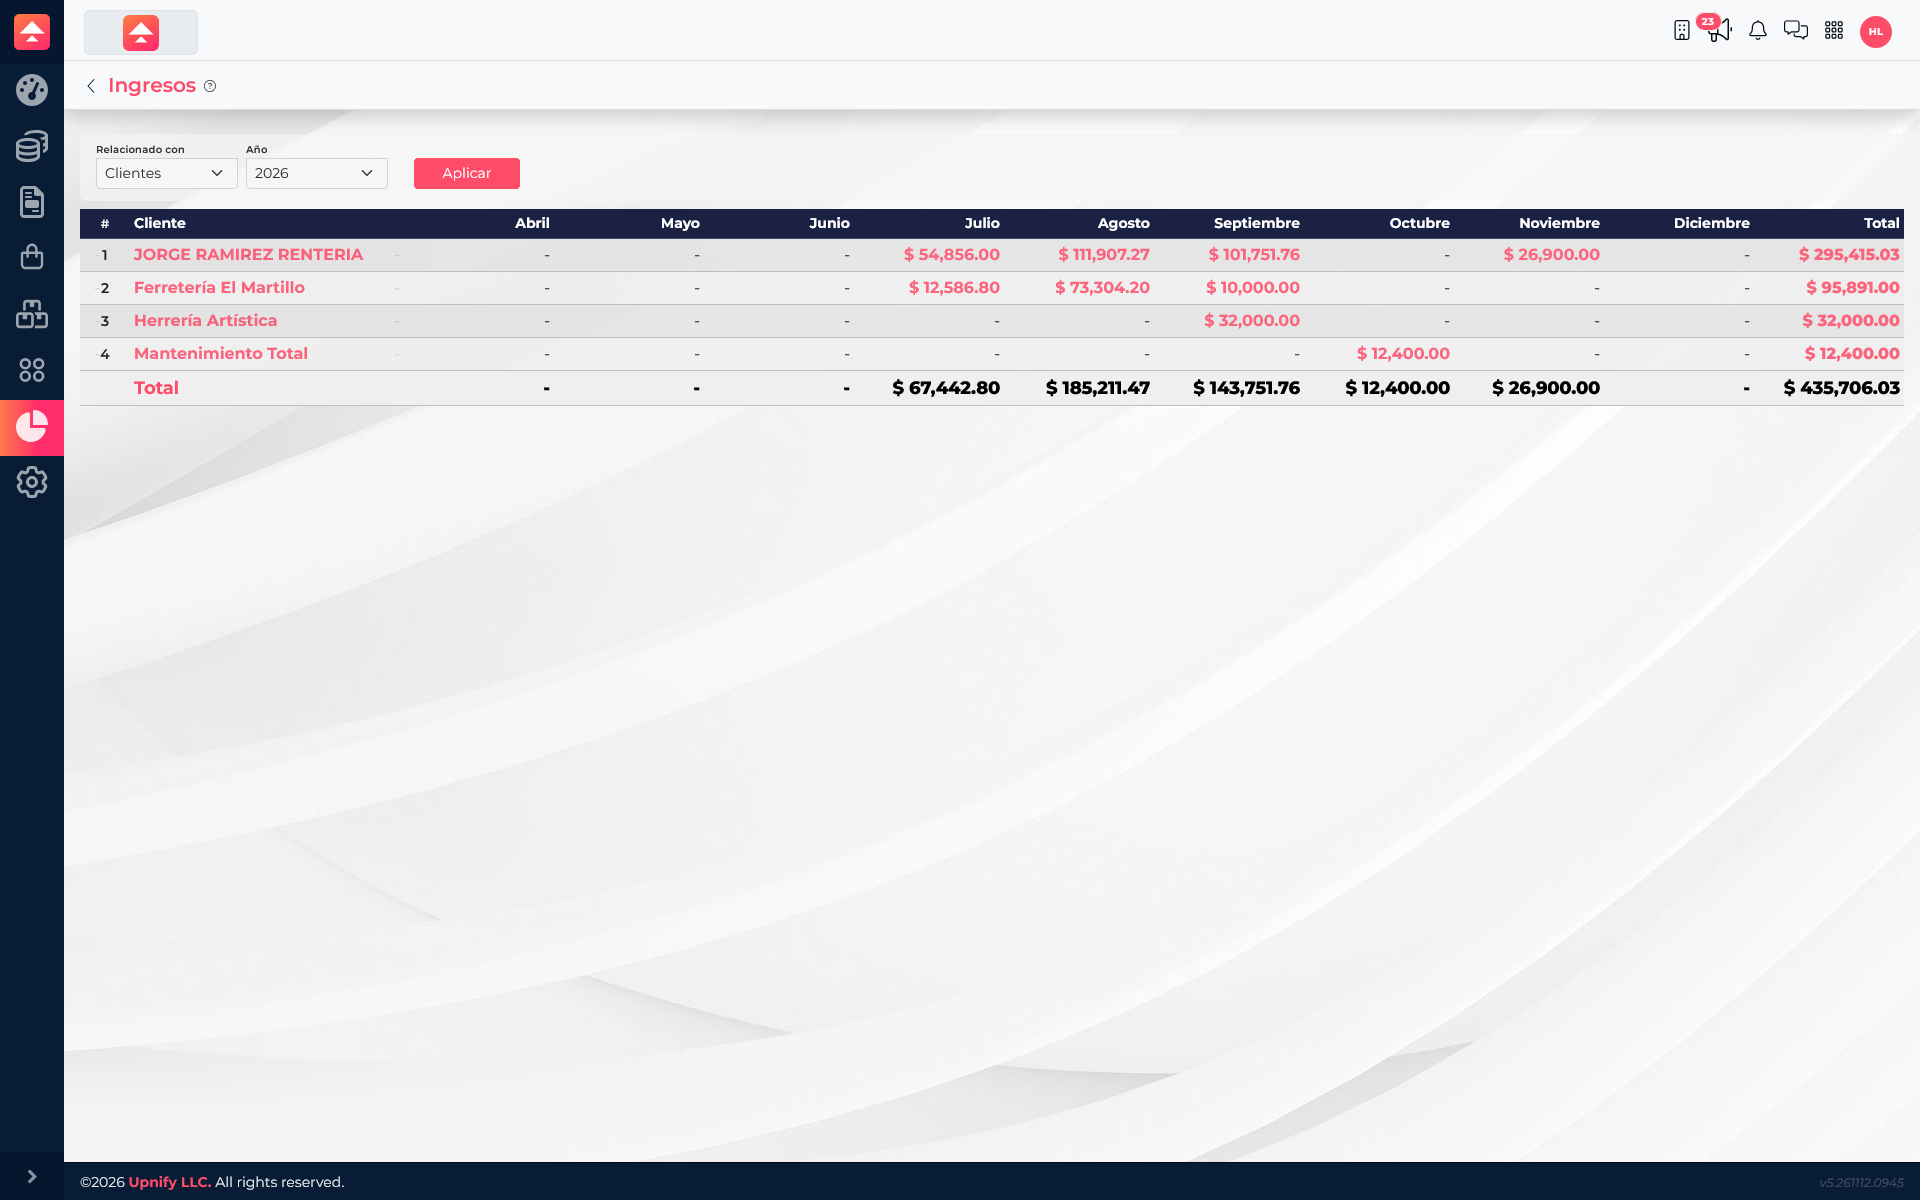
- Compare the monthly columns with the total. Amounts are grouped by the selected relationship, so changing this option can change the rows and total shown.
The report is grouped by customers: August totals MXN 185,211.47, including MXN 73,304.20 for Ferretería El Martillo and MXN 111,907.27 for Jorge Ramirez Rentería. In September, Herrería Artística also appears with MXN 32,000.00. Select a linked amount to review the records behind it.
Read expenses and compare
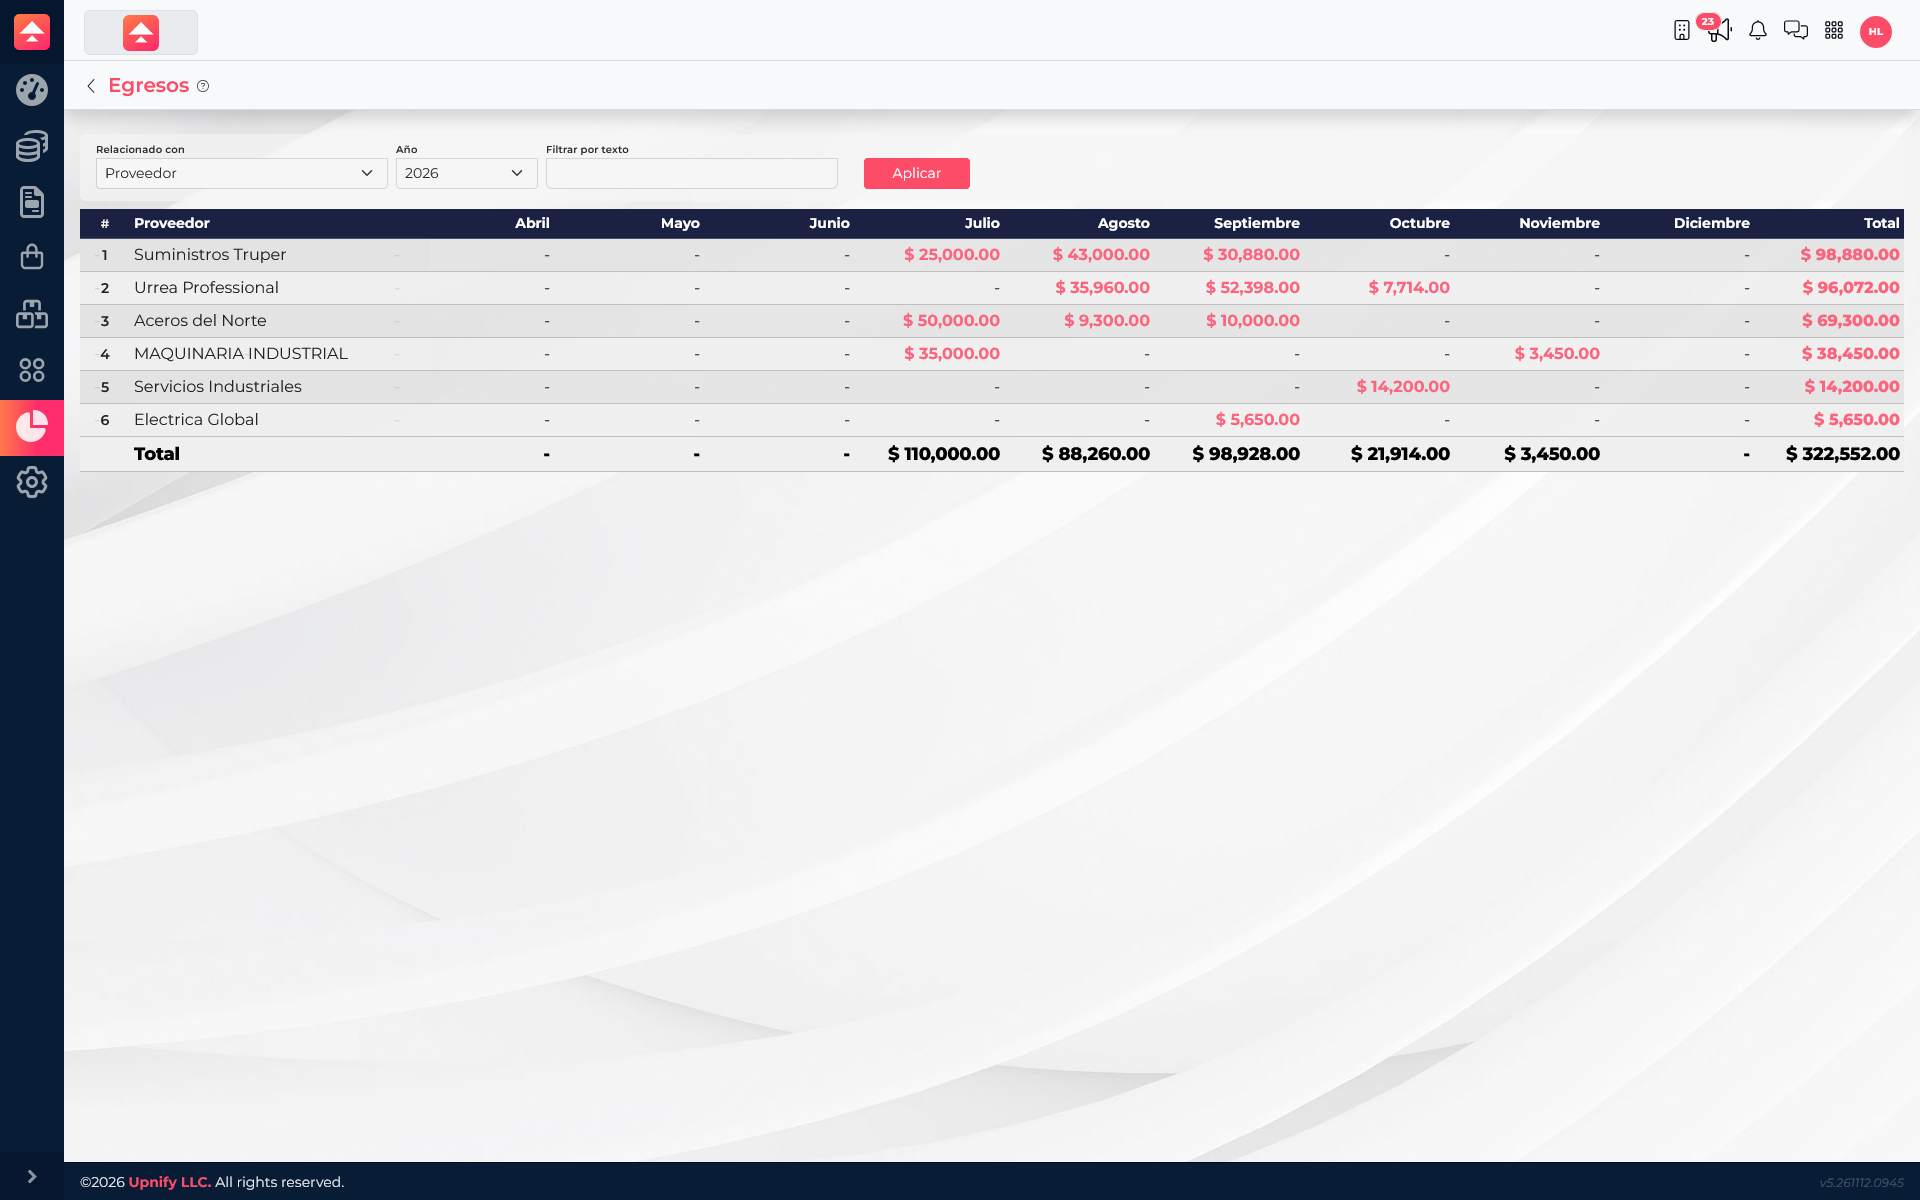
In General expenses, the grouping filter lets you review expenses by vendor, employee, transfer, customer, or items not related to another entity. You can also select a year and, when available, use the text field to find an entity or description.
The vendor-grouped report shows MXN 88,260.00 in August across several vendors; for example, Aceros del Norte accounts for MXN 9,300.00. In October, Servicios Industriales shows MXN 14,200.00, within a monthly total of MXN 21,914.00.
Select a monthly cell or total when it is linked to open the supporting documents. This lets you move from a summary to the transactions behind an amount.