Report: Collected vs. pending sales
Mon Jun 13 2022 07:08:27 GMT-0500 (hora estándar oriental)
View sales that have not yet been collected.
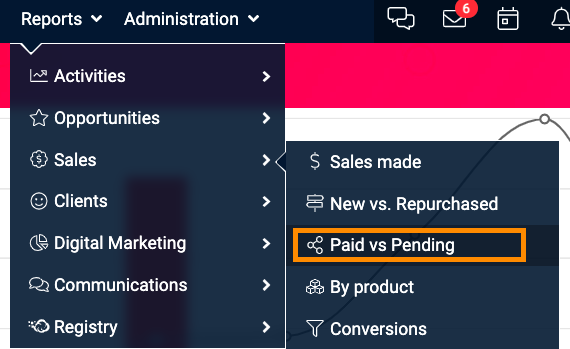
Go to Reports > Sales > Paid vs. Pending:
In this report you will be able to have a control of all those sales created that are pending to apply a collection or that have already been applied.
When you enter you will see a window similar to the following:

Filters:
To filter data in the report, use the filters located at the top:
- Group: You will be able to apply filter by executives, sales groups, product lines, origin: country, region, city or industry.
- Sales: Determine the type of report you want to visualize.
- Realized: It will show the amount of sales according to the creation date. If the contact was created in January, but created a sale in March, it will show the sale in the March column. Regardless of the status of the payments.
- Pending: Are those sales that have payments that have not been applied.
- Effectively collected: It will show the amount of the sales according to the creation date. If the contact was created in January, but created a sale in March, it will show the sale in the March column. TAKING INTO ACCOUNT THAT THE PAYMENT STATUS IS 'COLLECTED / MADE'.
- Made vs. collected: This is the comparison of how many sales were collected versus how many sales have been made.
- Year: Select the year for which you want to see the information.
- Group: By sales force group.
- Currency: Shows you the type of currencies you have registered in the system.
- Save to favorites: You can create the filter you require:

Graph:
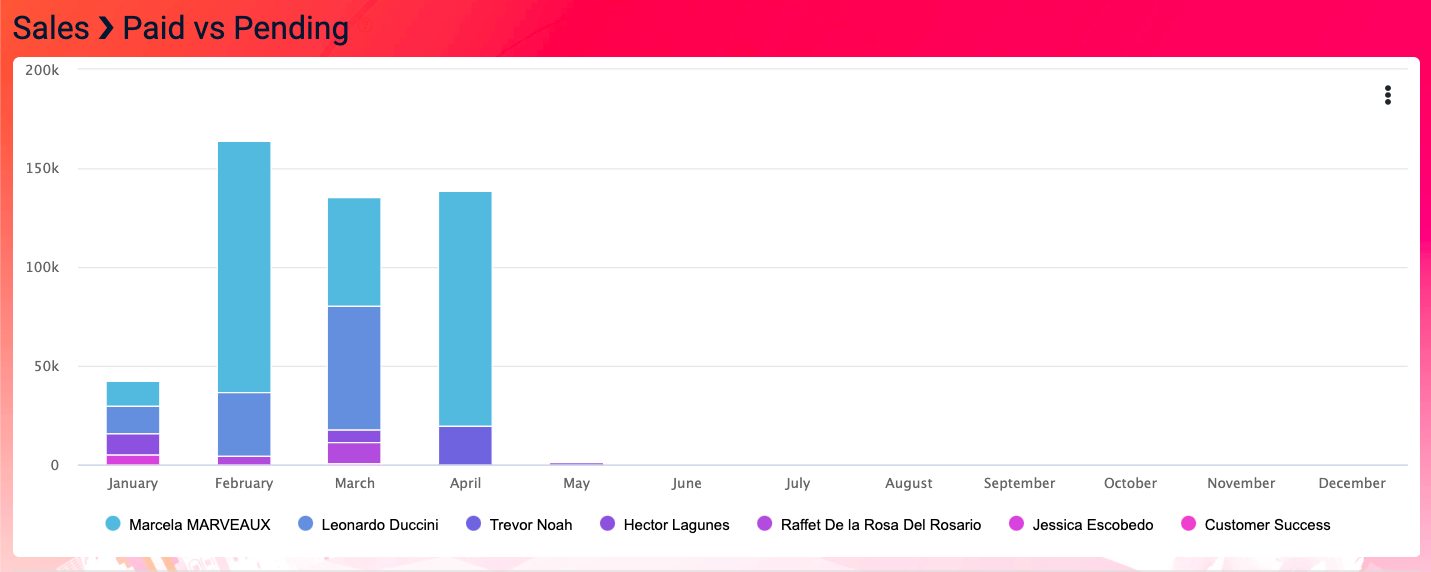
- The filtered information will be displayed in a graph.
- If you place the cursor over one of the bars it shows you the type of contact and the amount.
- You can select or deselect the information by clicking on the corresponding colored box so that only the name of the selected executive or group is displayed in the graph.
- It allows you to enter the sales detail where by clicking on the quantity or totals, you will see which are the contacts to whom a sale has been made.
- You can choose between displaying three graphs: stacked column, linear or comparative stacked column.
Export:
- The detail can be exported in CSV, JSON or MailChimp either the display data or all of it.
Important:
- Take into account the date the sale was created regardless of the date the contact was created.
- For example: If you created a direct sale in September as pending for $1,000, in this report in the 'Pending' filter will appear this amount $1,000.